Minnesota Poll: Harris leads Trump in close presidential race

Likely voters split evenly on the two candidates’ favorability although women and nonwhite voters prefer Harris while men and rural voters lean toward Trump.

Vice President Kamala Harris holds a slight lead over former President Donald Trump among likely Minnesota voters, according to a new poll released six weeks before Election Day.

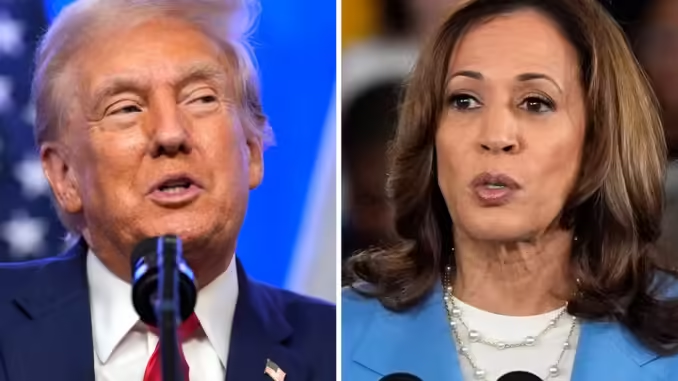
Likely Minnesota voters split evenly on the favorability of Republican presidential nominee former President Donald Trump and Democratic presidential nominee Vice President Kamala Harris. (The Associated Press)

The Minnesota Star Tribune/MPR News/KARE 11 Minnesota Poll found Harris and Minnesota Gov. Tim Walz with a 48% to 43% lead over Trump and Sen. JD Vance of Ohio. Seven percent of respondents said they remain undecided, while fewer than 2% of those polled said they would vote for a third-party candidate.

The poll’s findings are based on interviews with 800 likely Minnesota voters, conducted Sept. 16-18. The poll’s margin of error is plus or minus 3.5 percentage points. The last Minnesota Poll in June — before President Joe Biden dropped out of the race — showed Biden with a narrower four-point lead over Trump, 45% to 41%.

If the 2024 presidential election was held today, which one of the following presidential/vice presidential tickets would you vote for

Voters who have made a decision are firm in support of their candidate. More than 90% of those polled characterized themselves as either “very enthusiastic” or “somewhat enthusiastic” about their choice.

Valarie Jakosa, 57, said her opposition to Trump is grounded in his role in the failed insurrection on Jan. 6, 2021. Jakosa, a substitute teacher who lives in St. Paul Park, said she’s historically respected and been open to Republican candidates, but not Trump.

“I don’t see how somebody could do what the former president did and still be allowed to run for president,” she said.

A Navy veteran, Jakosa said she took an oath to uphold the U.S. Constitution. “If I, while I was in the Navy, had incited a riot that caused people to attack the Capitol, I would have gone to Fort Leavenworth because it would have been treasonous,” she said.

Another poll respondent, Nathan Witte of Fridley, supports Trump.


“I don’t think I’m necessarily a big fan of his personality all of the time or his rhetoric or the way he talks to people,” Witte, 35, said. “I can say I enjoyed a great amount of freedom while he was president and I’d like to see what he could do for our country in a second term.”

Witte said he hopes for more local control over revenue and tighter restraints at the borders.

Poll respondents gave Trump support on the economy and the border. When it came to abortion and protecting democracy, voters said they trusted Harris over Trump.


Witte said he’s not sure Trump can follow through on his promise of mass deportations, but that those with criminal backgrounds should be sent home. “We should have an understanding of who’s coming into our country and, frankly, we don’t,” Witte said.

Minnesotans have strong feelings about these two tickets. On overall favorability, 53% had an unfavorable impression of Trump while that number was 51% for Harris. Forty-six percent of Minnesotans have a favorable impression of Trump while 47% have a favorable impression of Harris.

Do you have a favorable or unfavorable opinion of …

Donald Trump
46%
53%
Kamala Harris
47%
51%

Trump lost Minnesota to Hillary Clinton by just over a percentage point in 2016 and to Biden by about 7 points in 2020.

Advertisement

Divides on gender, education, geographic and racial lines persisted in the poll, with men preferring Trump and women and college graduates favoring Harris.

Likely voters in Hennepin and Ramsey counties preferred Harris three to two over Trump. The former president led Harris by a small margin in the suburbs surrounding those two counties.

Trump was also favored in rural Minnesota, albeit by a smaller margin than Harris enjoyed in Hennepin and Ramsey counties.

Warren Rumsch of Anoka, a 78-year-old retired biology teacher, is willing to look past Trump’s legal troubles, noting that other presidents have had “skeletons” and are still held in high regard.

“I look at what he accomplished in his first term,” Rumsch said. “When he talks about the swamp, I believe there’s a lot of problems in Washington. I think it’s good when we have a nonpolitician in Washington.”

Under Trump, Rumsch said, the border was more secure, the economy was better and he offered a more measured transition away from fossil fuels. “I’m concerned about the environment but I don’t think it’s wise of us to launch ourselves with such fervor into electric cars.”

Rumsch is also concerned about unauthorized immigrants and the strain that urban sprawl is creating.

“As a biologist, I worry about our environment. I see the spread of our cities and people moving into places that have wildlife,” he said. “I can remember the vast open spaces we had.”

Immigrants need to “melt into the melting pot,” he added.

The biggest favorability gap came between white and non-white Minnesotans. Non-white Minnesotans favored Harris over Trump three to one. White Minnesotans were closely divided on Trump’s favorability. Harris had a somewhat higher unfavorability rating among whites.

Bemidji-based business lawyer Charlie Dolson grew up on the Red Lake Indian Reservation and is an enrolled member. The 47-year-old Democrat served four years in the Marines, has an MBA and is firmly in the Harris-Walz camp.

“Democrats have sent the economy in the right direction,” Dolson said. “I am totally in disbelief that anybody would suggest tariffs. I can’t believe anyone would actually think that’s good for the economy.”

Trump is calling for significant tariffs on goods from other countries, saying it would boost domestic production.

Dolson said he appreciates that Democrats, including Walz, support road projects over austerity. “Being efficient and frugal is a good thing, but what I think is better is expanding the tax base,” he said.

Like fellow veteran Jakosa, Dolson also said Trump’s role on Jan. 6 is disqualifying. “At the end of the day you need ethical people,” Dolson said. “I would not ever be voting for him. Would I vote for a Republican with a better economic plan? I would definitely listen to it.”

FULL RESULTS

The Star Tribune, MPR News and KARE 11 interviewed 800 Minnesota registered voters between Sept. 16 and Sept. 18, 2024. All indicated they are likely to vote in the November general election. Findings from questions about the presidential race and key issues are below. Totals may not add up to 100% due to rounding. Click here for details about how the poll was conducted, a map of the Minnesota regions used in this poll and the demographics of the 800 respondents.
Do you have a favorable or unfavorable opinion of Donald Trump?

Table with 4 columns and 16 rows.
TOTAL 46% 53% 1%
Hennepin/ Ramsey 31% 68% 1%
Rest of metro 51% 49% 0%
Southern Minnesota 54% 44% 2%
Northern Minnesota 56% 43% 2%
Men 57% 42% 2%
Women 37% 63% 1%
DFL/ Democrat 3% 97% 0%
Republican 96% 2% 2%
Independent/ other 48% 51% 1%
<50 41% 58% 1%
50+ 50% 48% 2%
No college degree 52% 47% 1%
College graduate 39% 60% 1%
White 49% 49% 1%
Nonwhite 22% 78% 0%

Do you have a favorable or unfavorable opinion of Kamala Harris?

Table with 4 columns and 16 rows.
TOTAL 47% 51% 2%
Hennepin/ Ramsey 62% 37% 2%
Rest of metro 44% 55% 1%
Southern Minnesota 39% 59% 1%
Northern Minnesota 38% 58% 4%
Men 37% 61% 2%
Women 57% 41% 2%
DFL/ Democrat 91% 8% 1%
Republican 2% 95% 3%
Independent/ other 41% 57% 2%
<50 53% 46% 1%
50+ 43% 54% 2%
No college degree 43% 55% 2%
College graduate 53% 46% 2%
White 44% 54% 2%
Nonwhite 72% 27% 1%

If the 2024 presidential election was held today, which one of the following presidential/vice presidential tickets would you vote for:

On a mobile device? Scroll right for all responses →

Table with 5 columns and 16 rows.
TOTAL 48% 43% 2% 7%
Hennepin/ Ramsey 64% 28% 1% 8%
Rest of metro 43% 48% 2% 7%
Southern Minnesota 40% 52% 2% 6%
Northern Minnesota 40% 53% 1% 6%
Men 37% 53% 2% 9%
Women 59% 35% 1% 5%
DFL/ Democrat 94% 3% 1% 2%
Republican 2% 92% 2% 5%
Independent/ other 41% 43% 2% 14%
<50 53% 38% 2% 8%
50+ 45% 47% 1% 6%
No college degree 44% 49% 1% 6%
College graduate 54% 37% 2% 7%
White 45% 46% 1% 7%
Nonwhite 72% 20% 2% 6%

How enthusiastic are you about your preferred presidential candidate this year?

Table with 5 columns and 3 rows.
TOTAL 76% 15% 9% 1%
Harris 79% 13% 7% 1%
Trump 73% 17% 10% 1%

How would you rate economic conditions in this country today: Would you say they are:

On a mobile device? Scroll right for all responses →

Table with 6 columns and 16 rows.
TOTAL 4% 27% 27% 41% 2%
Hennepin/ Ramsey 6% 34% 29% 30% 2%
Rest of metro 4% 23% 25% 48% 0%
Southern Minnesota 4% 27% 24% 44% 1%
Northern Minnesota 3% 22% 27% 44% 4%
Men 4% 21% 29% 44% 2%
Women 5% 32% 24% 37% 2%
DFL/ Democrat 7% 53% 28% 12% 1%
Republican 0% 5% 27% 68% 0%
Independent/ other 5% 19% 26% 46% 4%
<50 6% 27% 28% 38% 1%
50+ 3% 27% 26% 43% 2%
No college degree 3% 24% 26% 45% 2%
College graduate 5% 30% 28% 36% 1%
White 4% 26% 27% 42% 2%
Nonwhite 5% 36% 30% 30% 0%

Which one of the following approaches to handling the abortion issue do you most support: Laws regarding abortion rights and restrictions should be uniform across the country and determined by federal law, or laws regarding abortion rights and restrictions should be allowed to differ from state to state and determined by individual state laws?

Table with 4 columns and 16 rows.
TOTAL 46% 48% 6%
Hennepin/ Ramsey 58% 37% 6%
Rest of metro 40% 52% 8%
Southern Minnesota 41% 53% 7%
Northern Minnesota 40% 54% 6%
Men 38% 56% 6%
Women 53% 40% 7%
DFL/ Democrat 81% 13% 7%
Republican 14% 76% 10%
Independent/ other 37% 61% 3%
<50 51% 43% 6%
50+ 42% 52% 7%
No college degree 42% 51% 6%
College graduate 50% 44% 6%
White 43% 51% 6%
Nonwhite 68% 26% 5%

How serious of a problem do you think the issue of illegal immigration is for the country right now? Is it:

On a mobile device? Scroll right for all responses →

Table with 5 columns and 16 rows.
TOTAL 47% 32% 16% 5%
Hennepin/ Ramsey 33% 39% 20% 8%
Rest of metro 54% 30% 14% 2%
Southern Minnesota 53% 28% 16% 4%
Northern Minnesota 56% 28% 12% 5%
Men 54% 27% 16% 3%
Women 41% 36% 16% 7%
DFL/ Democrat 8% 52% 29% 10%
Republican 87% 11% 2% 0%
Independent/ other 53% 28% 14% 4%
<50 42% 32% 19% 7%
50+ 51% 32% 13% 4%
No college degree 54% 28% 13% 4%
College graduate 39% 36% 19% 6%
White 50% 30% 15% 5%
Nonwhite 27% 45% 23% 4%

Do you think democracy in our country is or is not currently being threatened?

Table with 4 columns and 16 rows.
TOTAL 68% 25% 7%
Hennepin/ Ramsey 72% 23% 6%
Rest of metro 66% 25% 8%
Southern Minnesota 68% 25% 8%
Northern Minnesota 66% 26% 9%
Men 63% 29% 8%
Women 73% 20% 7%
DFL/ Democrat 81% 16% 3%
Republican 58% 32% 11%
Independent/ other 64% 27% 9%
<50 69% 23% 8%
50+ 68% 26% 7%
No college degree 68% 24% 8%
College graduate 69% 25% 7%
White 67% 25% 8%
Nonwhite 74% 20% 6%

Which presidential candidate do you trust more to handle the economy — Kamala Harris, the Democrat, or Donald Trump, the Republican?

Table with 4 columns and 16 rows.
TOTAL 45% 52% 3%
Hennepin/ Ramsey 57% 39% 4%
Rest of metro 42% 56% 1%
Southern Minnesota 39% 58% 4%
Northern Minnesota 38% 59% 3%
Men 35% 61% 4%
Women 55% 43% 2%
DFL/ Democrat 94% 6% 0%
Republican 1% 98% 1%
Independent/ other 33% 59% 8%
<50 49% 47% 4%
50+ 43% 56% 2%
No college degree 41% 57% 2%
College graduate 51% 45% 4%
White 42% 55% 3%
Nonwhite 67% 30% 3%

Which presidential candidate do you trust more to handle issues related to abortion — Kamala Harris, the Democrat, or Donald Trump, the Republican?

Table with 4 columns and 16 rows.
TOTAL 53% 42% 5%
Hennepin/ Ramsey 69% 27% 4%
Rest of metro 49% 46% 5%
Southern Minnesota 44% 50% 6%
Northern Minnesota 44% 51% 6%
Men 43% 51% 5%
Women 63% 33% 5%
DFL/ Democrat 97% 3% 0%
Republican 7% 83% 10%
Independent/ other 48% 46% 6%
<50 59% 37% 4%
50+ 49% 45% 6%
No college degree 48% 48% 4%
College graduate 59% 35% 6%
White 50% 45% 6%
Nonwhite 80% 19% 1%

Which presidential candidate do you trust more to handle immigration — Kamala Harris, the Democrat, or Donald Trump, the Republican?

Table with 4 columns and 16 rows.
TOTAL 45% 53% 2%
Hennepin/ Ramsey 59% 40% 1%
Rest of metro 39% 60% 2%
Southern Minnesota 38% 60% 2%
Northern Minnesota 38% 59% 4%
Men 33% 64% 3%
Women 55% 44% 1%
DFL/ Democrat 93% 5% 2%
Republican 1% 96% 3%
Independent/ other 32% 67% 1%
<50 52% 47% 1%
50+ 39% 59% 2%
No college degree 38% 60% 2%
College graduate 52% 46% 2%
White 42% 57% 2%
Nonwhite 68% 28% 3%

Which presidential candidate do you trust more to protect democracy — Kamala Harris, the Democrat, or Donald Trump, the Republican?

Table with 4 columns and 16 rows.
TOTAL 51% 45% 4%
Hennepin/ Ramsey 66% 30% 5%
Rest of metro 46% 51% 3%
Southern Minnesota 44% 52% 4%
Northern Minnesota 43% 53% 4%
Men 41% 53% 6%
Women 61% 37% 2%
DFL/ Democrat 96% 5% 0%
Republican 4% 92% 4%
Independent/ other 45% 46% 8%
<50 55% 40% 5%
50+ 48% 48% 4%
No college degree 46% 51% 4%
College graduate 57% 38% 5%
White 48% 48% 4%
Nonwhite 74% 24% 2%
Stay tuned for more update

Be the first to comment

Leave a Reply

Your email address will not be published.


*